
Vehicles carrying a bundle of driver assistance features post collision claim severity roughly 10% higher than otherwise identical models without them, yet their overall collision losses run about 5% lower, according to a Highway Loss Data Institute comparison of 2017-22 model year vehicles. Matt Moore, chief insurance operations officer at IIHS-HLDI, set out that divergence in a new IIHS analysis published this week. The reconciling factor is frequency: the sensors are expensive to replace and often require calibration afterward, but equipped vehicles are involved in fewer crashes to begin with.
Highlights
- Collision claim severity ran about 10% higher for 2017-22 model year vehicles equipped with a driver assistance bundle versus otherwise identical unequipped models.
- Property damage liability claim severity was 15% higher for the equipped vehicles — a gap sensor repair costs cannot explain.
- Claim frequency was about 10% lower for collision and almost 40% lower for PDL on equipped vehicles.
- Overall losses came in about 5% lower for collision coverage and almost 30% lower for PDL.
What Is Driving Vehicle Repair Costs Higher?
The average price of vehicle repairs has risen more than 40% since 2020, according to the U.S. Bureau of Labor Statistics — well ahead of the rate of inflation. Moore notes that the figure captures neither the repairs avoided because vehicles never crashed nor the range of factors behind the increase.
Crash avoidance sensors absorb much of the blame, but they are one input among several. Headlight assemblies have grown more sophisticated. SUVs and pickups now dominate the market in place of hatchbacks and sedans. Mainstream cars carry equipment once reserved for luxury models. Nearly two-thirds of new vehicles have all-wheel or four-wheel drive, and more than half have turbocharged or hybrid engines or are fully electric.
Each of those shifts adds cost. Larger vehicles generate more energy in a crash and sustain more severe damage. Higher-content equipment — power seats, elaborate entertainment systems — costs more to fix than the basics it replaced. Advanced powertrains carry more components that can break and often require specialized expertise to service.
The Sensor Premium Is Real
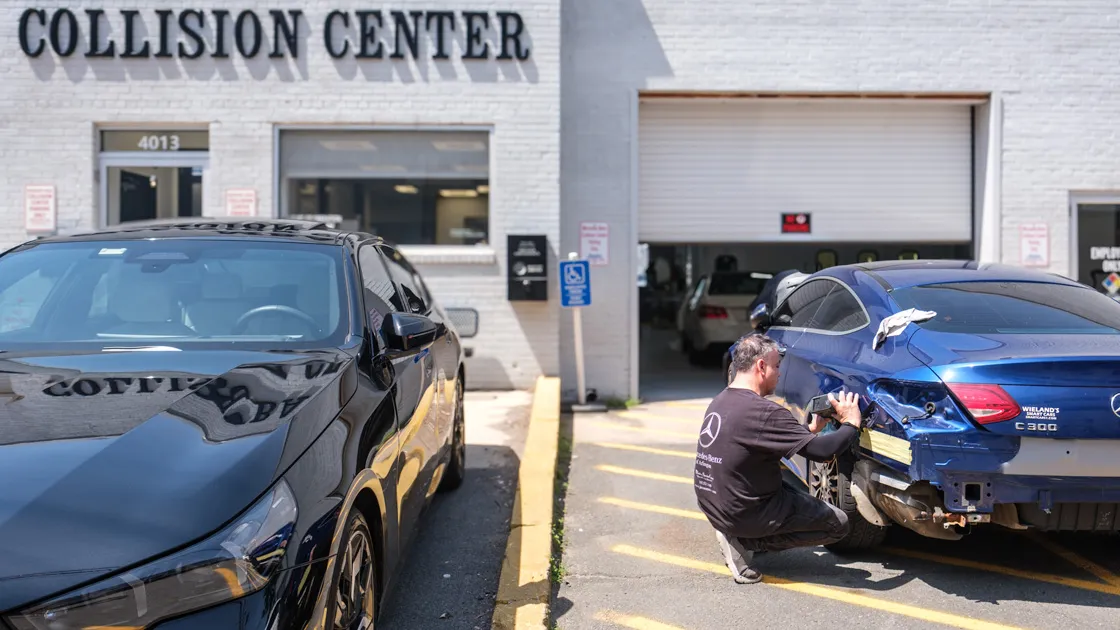
The repair-cost effect of advanced driver assistance systems shows up clearly at the individual-crash level. Take two identical models in the same front-to-rear collision, one equipped with automatic emergency braking, lane departure warning and blind spot warning and one without: the equipped vehicle costs more to repair. The sensors are expensive, and replacement frequently triggers a calibration requirement.
How Insurers Measure the Trade-Off
Three metrics separate the repair bill from the total cost. Claim severity is the dollar amount needed to settle a claim, which makes it a workable proxy for repair costs. Claim frequency counts how often claims are filed, and it is the measure that prices in the repairs that never happened. Overall losses are the product of the two.
Across the 2017-22 model year comparison, the three metrics move in different directions:
| Metric | Collision coverage | Property damage liability |
|---|---|---|
| Claim severity | ~10% higher | ~15% higher |
| Claim frequency | ~10% lower | Almost 40% lower |
| Overall losses | ~5% lower | Almost 30% lower |
Why Did PDL Severity Rise Even More?
Property damage liability coverage pays for damage to the vehicle struck by the policyholder — not the insured vehicle. Yet PDL claim severity ran 15% higher for the equipped vehicles, a larger gap than collision. Sensor replacement costs on the policyholder’s own car cannot account for damage repaired on someone else’s.
Moore attributes the result to arithmetic rather than sensor content. Crash avoidance systems prevent many of the low-speed fender benders that make up the bulk of claims under both coverages. With those minor claims removed, higher-speed crashes account for a larger share of what remains, pulling the average severity up.
What It Means for Drivers
The frequency numbers move the other way, and they move further. Equipped vehicles in the same study posted roughly 10% fewer collision claims and almost 40% fewer PDL claims. Multiplied through, overall losses landed about 5% lower for collision coverage and almost 30% lower for PDL.
That result is not confined to insurers’ balance sheets. Moore argues that drivers of equipped vehicles come out ahead on average as well, since every avoided crash is a deductible never paid. He also separates crash avoidance from the other cost drivers on safety grounds: unlike light bars or turbochargers, these systems produce substantial reductions in injury claim frequency — injuries avoided rather than dollars saved.
Subscribe to The BRAKE Report. Get free sample chapters.